Ownership, valuation, zoning and building data for every property in South Africa — not just the ones that are for sale.
Every figure shows its source and the date it was captured.
FoundRE estimate · confidence medium · Sep 2026
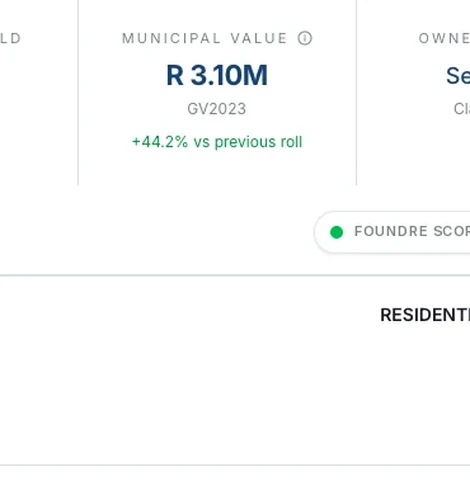
Tshwane GV roll · 2023
National cadastral survey · 2025
Municipal planning GIS · 2025
Deeds registry · Aug 2026
Multi-source footprints · 2026
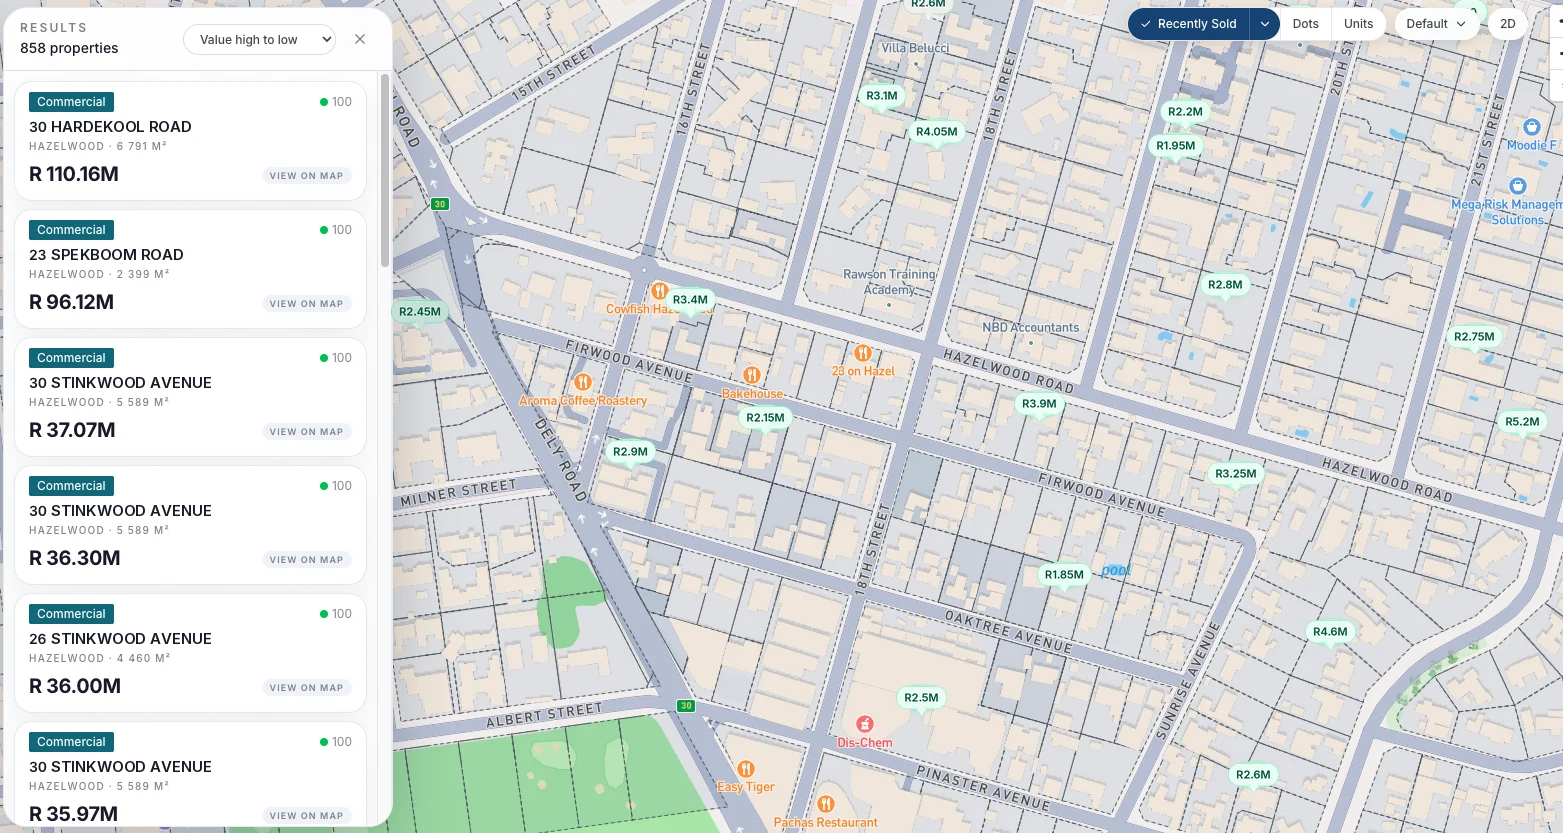
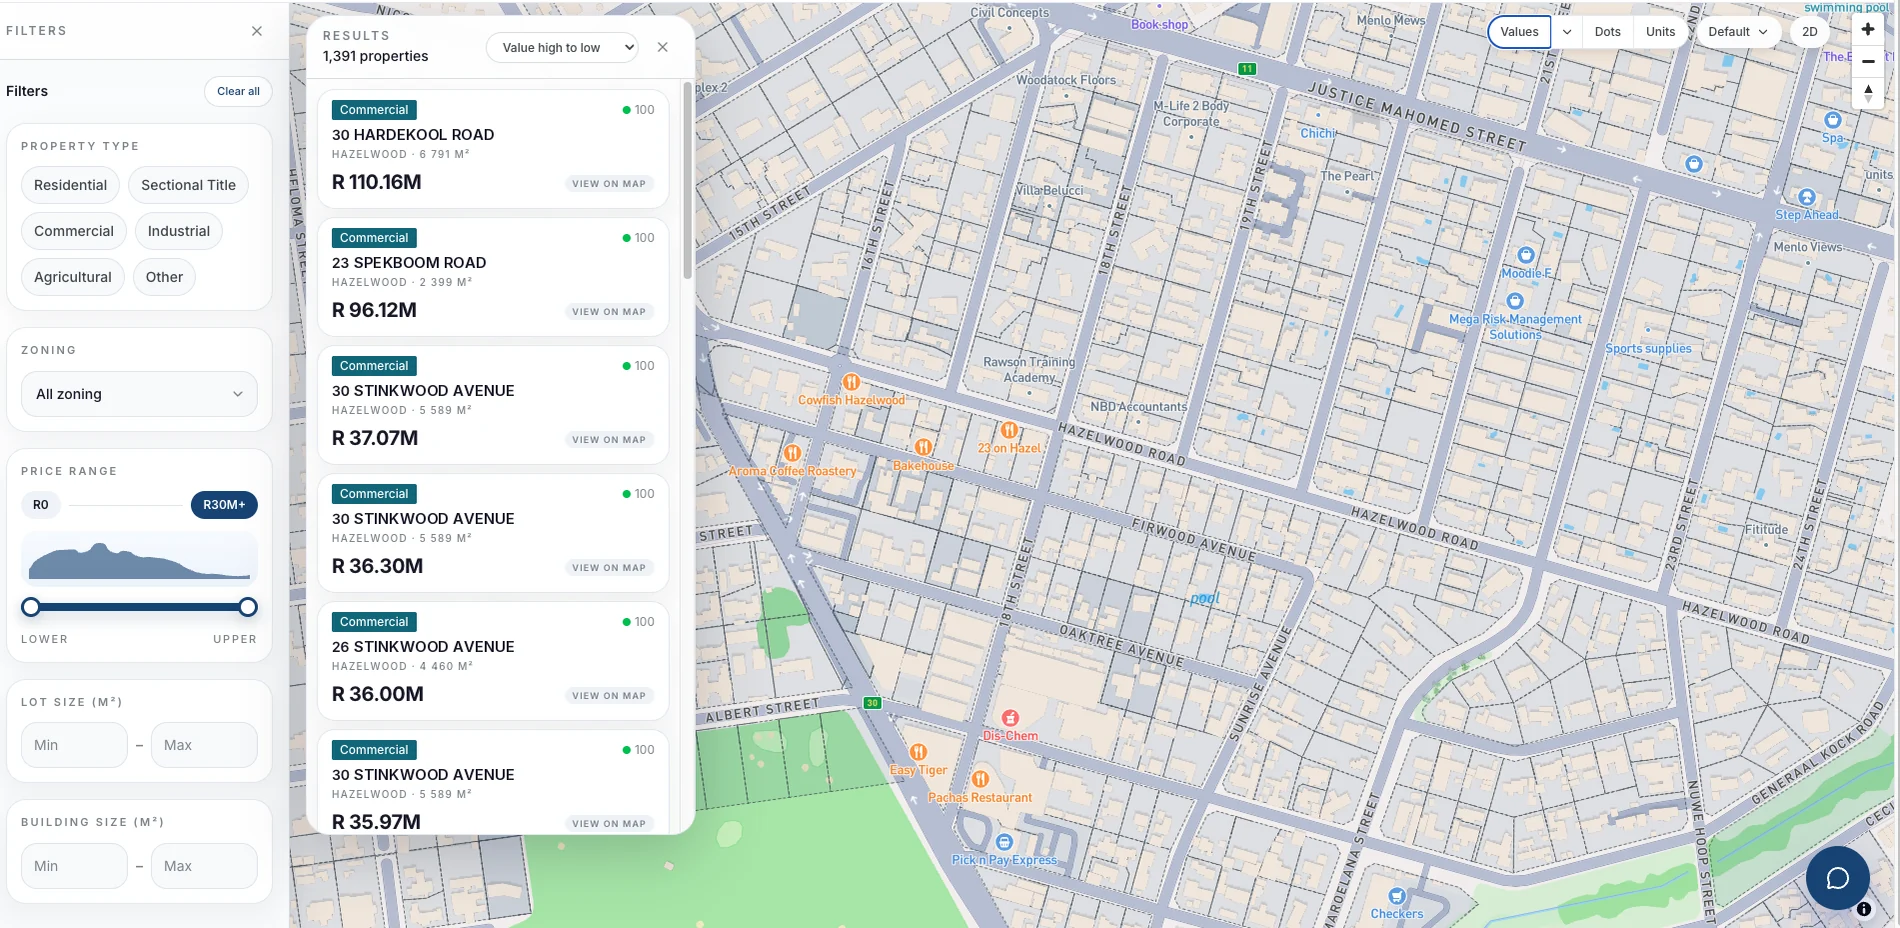
Built around a map, with details about every property one click away.
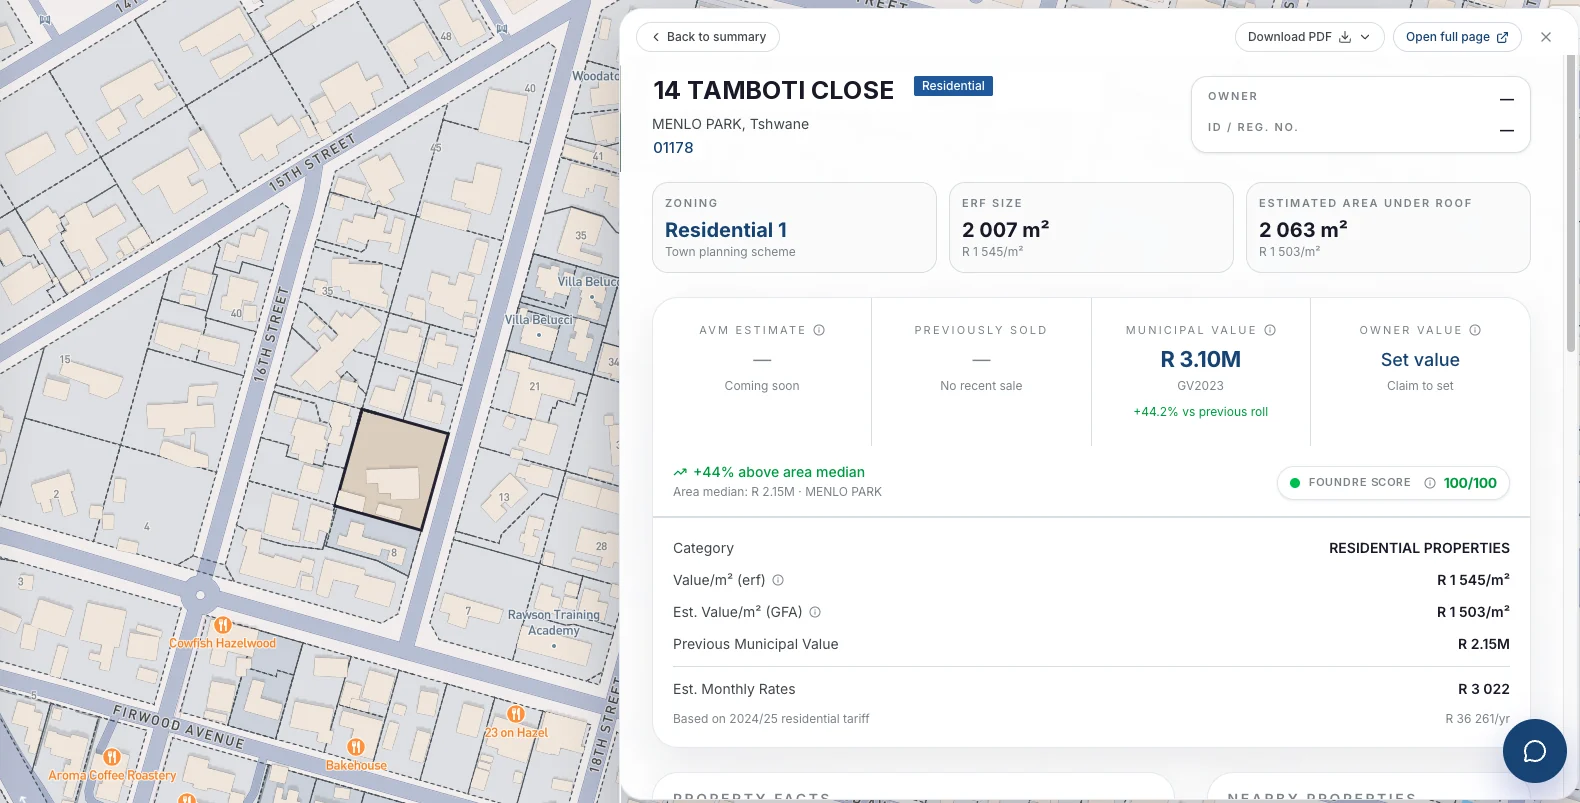
Zoning, erf size, area under roof, coverage, rates and municipal value — with the cadastral fact on one side and the measured building on the other. Owner fields stay blank unless you have the standing to see them.
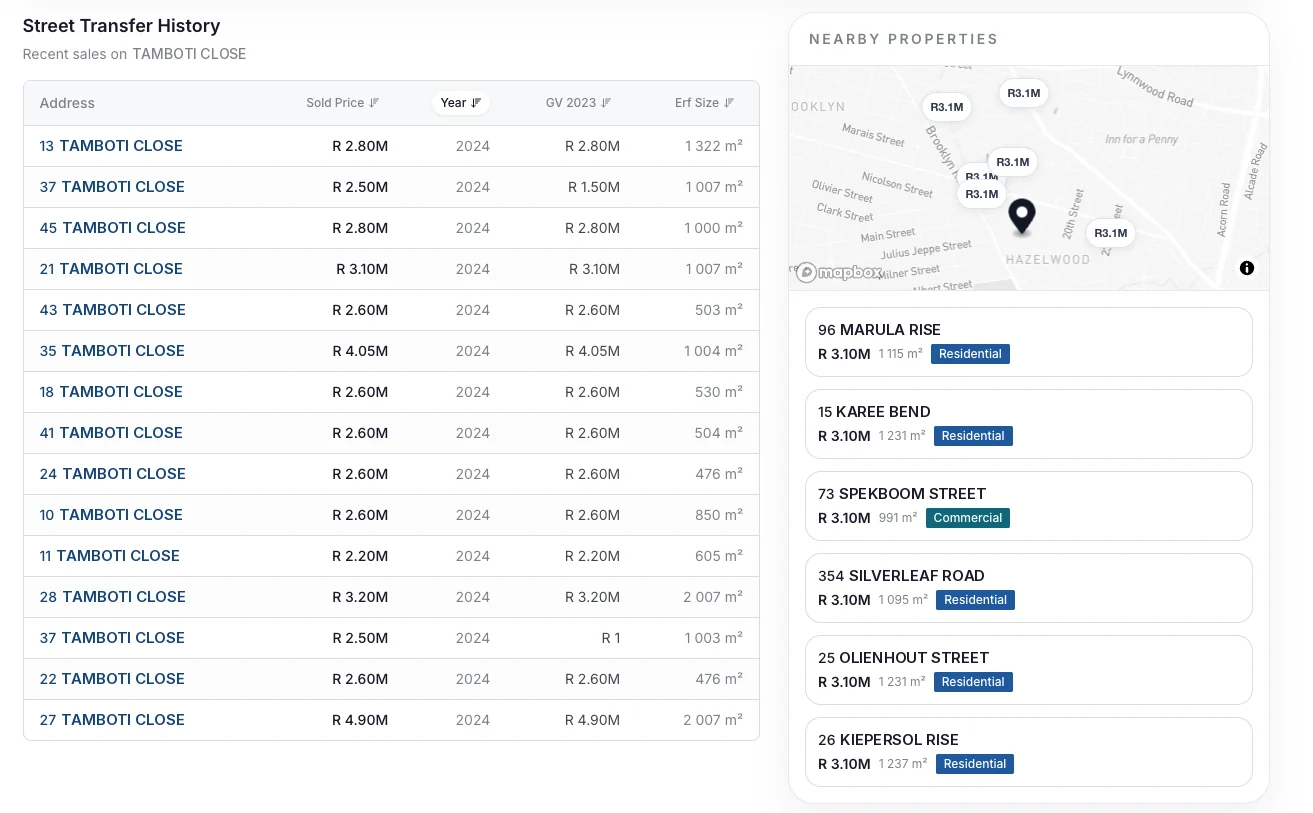
Every recorded transfer for the property, its municipal valuation history, and then every recent sale on the same street — sortable by price, year, municipal value or erf size.
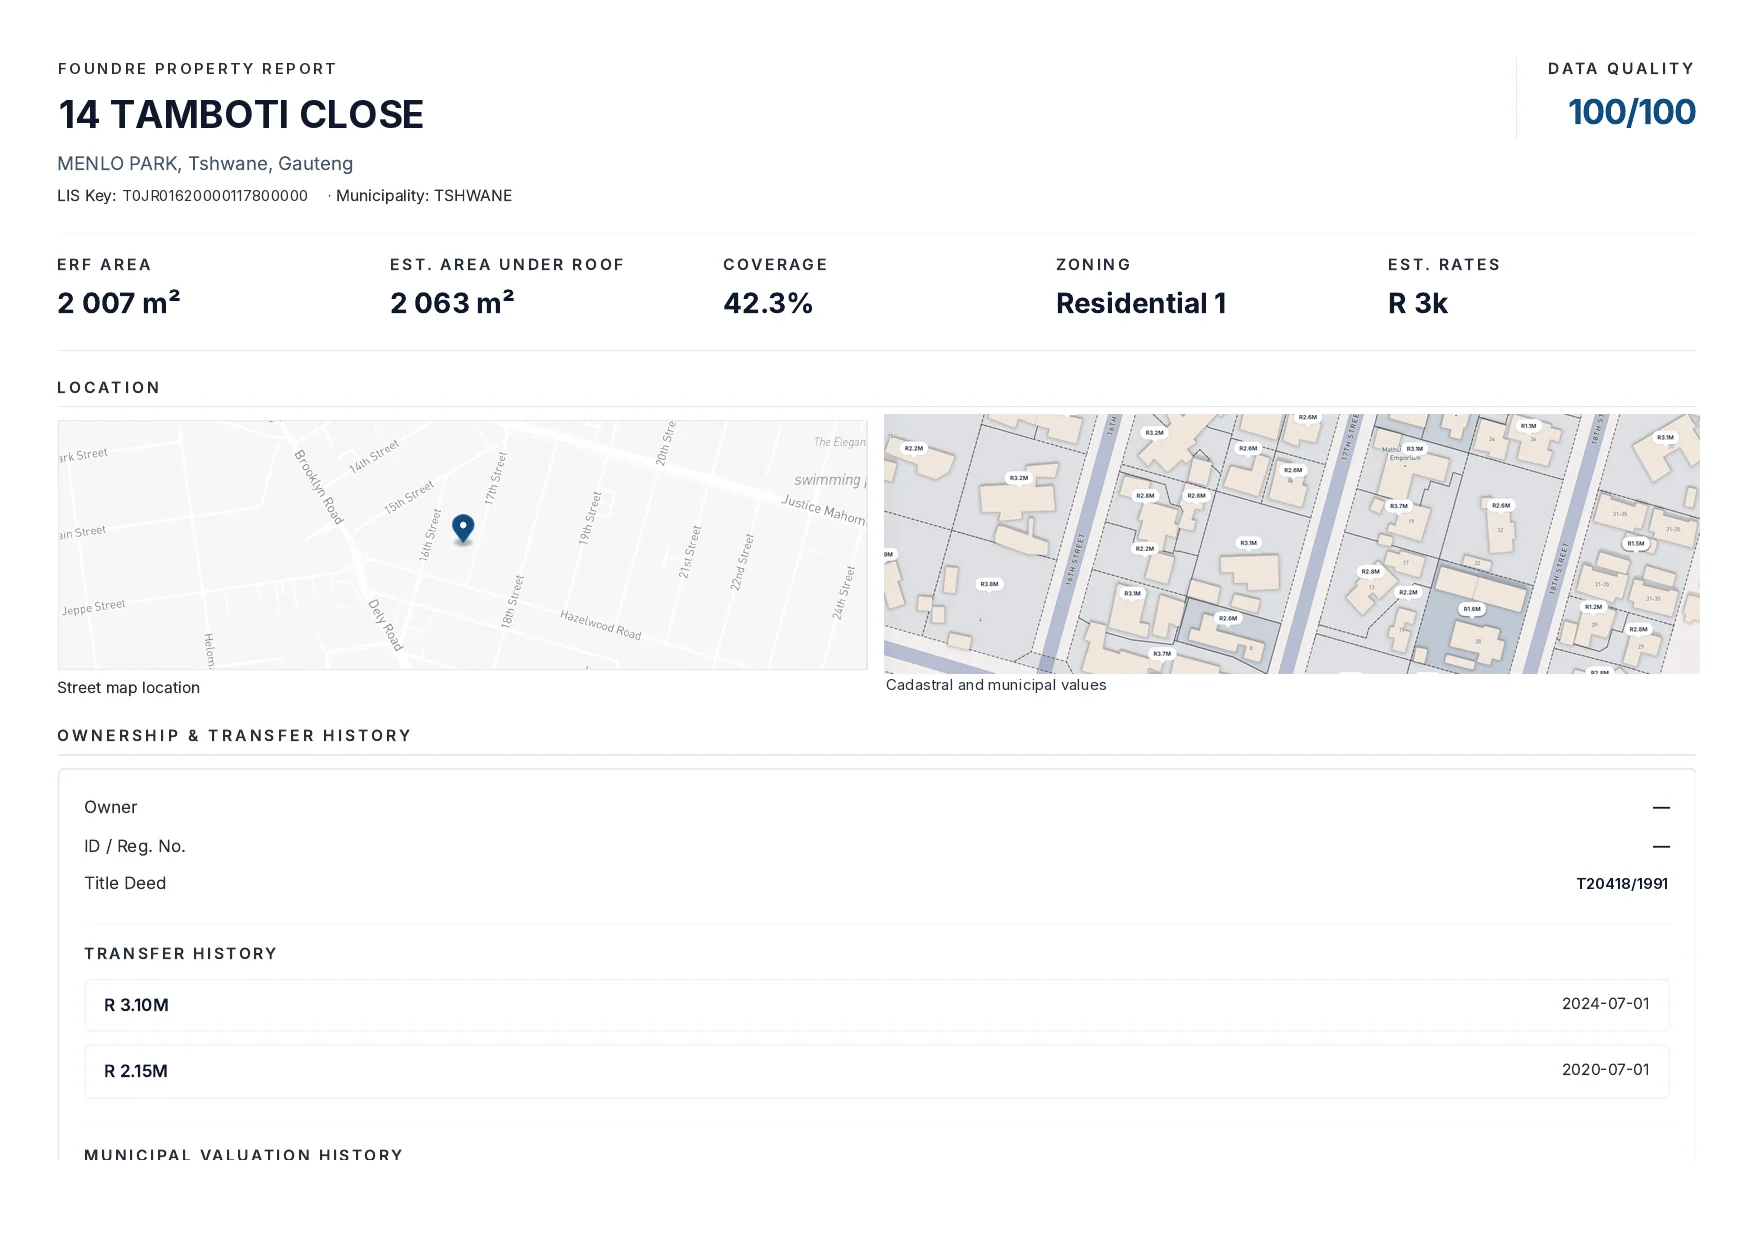
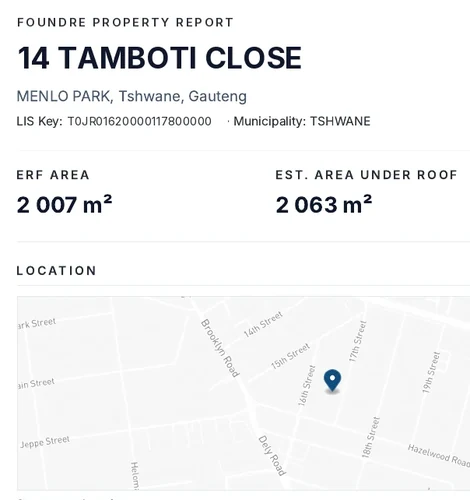
The Property Report is a client-ready PDF carrying the headline figures, location, ownership and transfer history, valuation summary, building intelligence and area market context — generated on demand and dated. Suburb, Town and AVM reports follow.
Find by address, erf number or suburb, then filter by property type, zoning, value, erf size and building size.
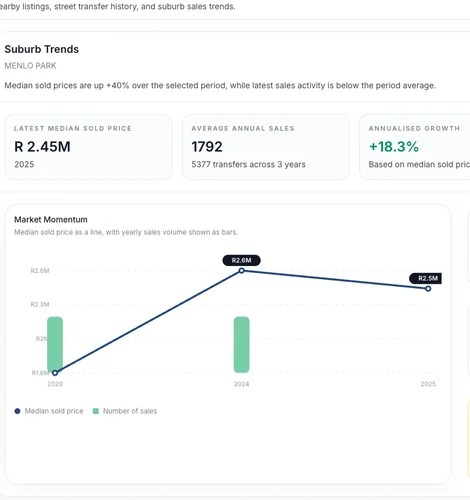
An area profile and a market trend built from recorded transfers, so a property can be judged against its neighbourhood.
Unit counts, total scheme value and scheme zoning — a block of flats read as a scheme rather than as one address.
Take a filtered set out as CSV, or bring the same reconciled record into your own systems.
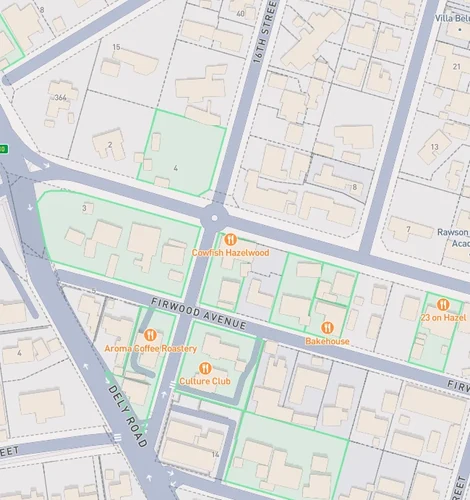
Every property in the country on one map — boundaries at street zoom, building footprints and heights above that, value density across a whole suburb in a single view.
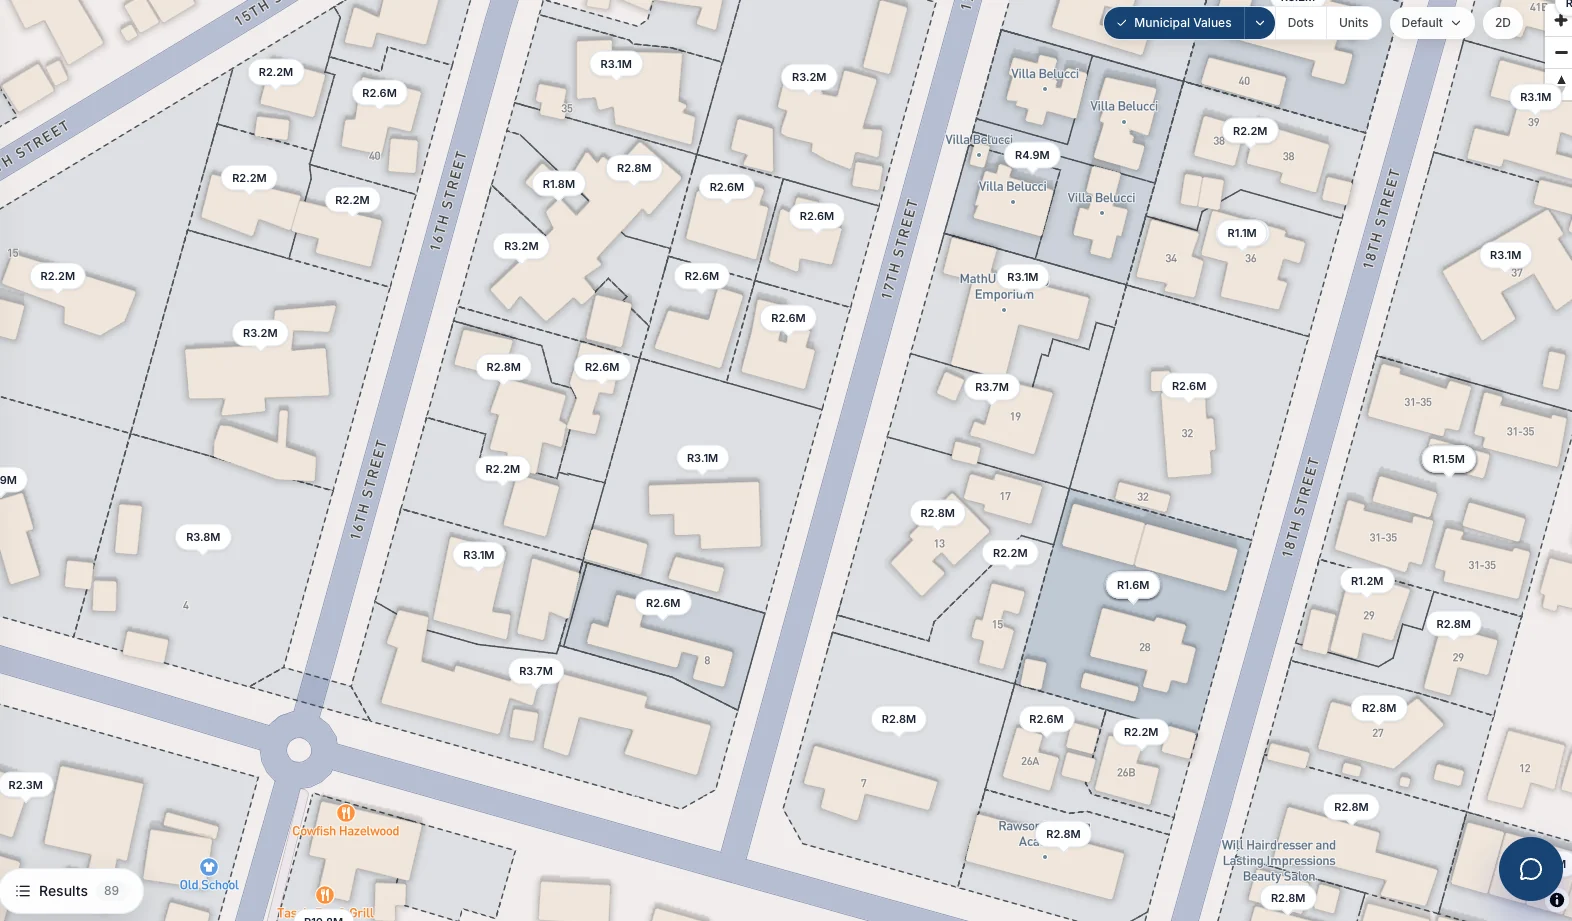
Every erf carries its value, on the boundary itself.
The last recorded transfer price, street by street.
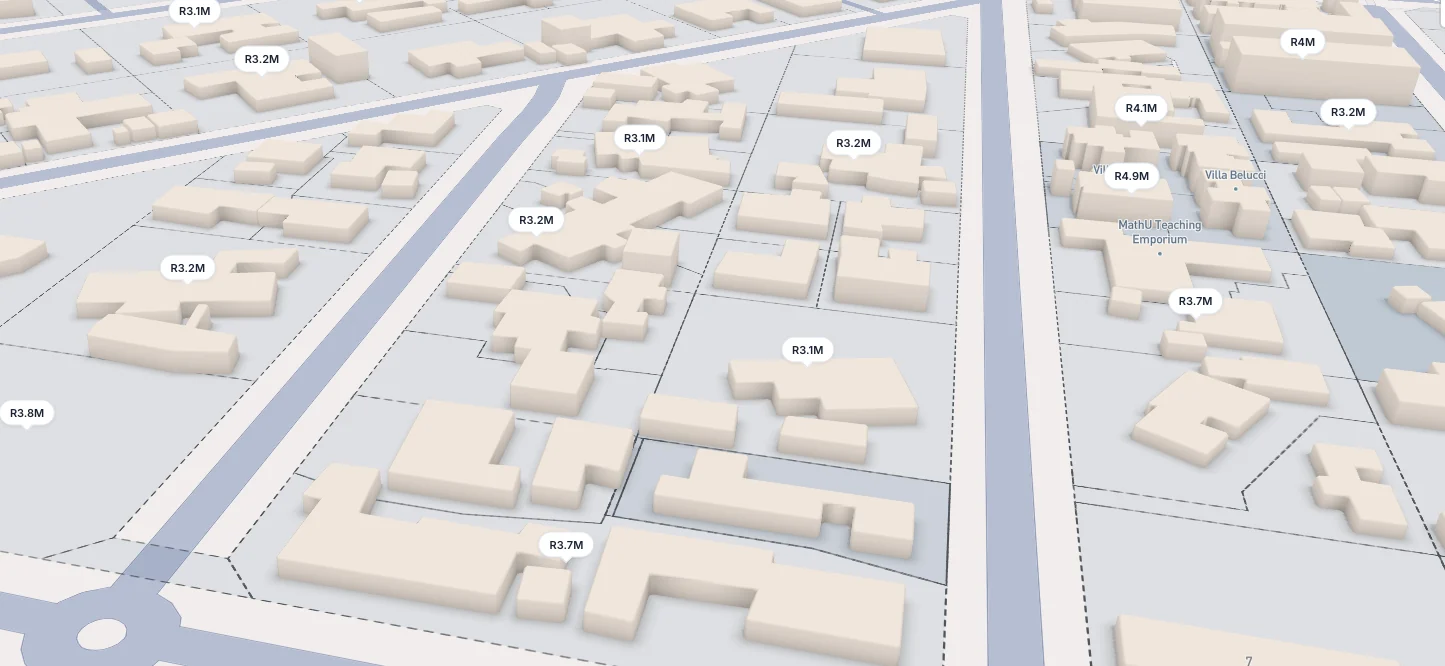
Coverage and bulk, in three dimensions.
Screens captured from the platform · Identifiers replaced with an invented record · Sale prices are illustrative
Only a small fraction of South African homes are ever listed. Everything else — who owns it, what it is worth, what may be built on it — sits with municipalities, the Deeds Office and a handful of paid gatekeepers, priced per lookup and delivered without context.
FoundRE brings those records onto one map and reconciles them against each other, so a property you could only partly see becomes a property you can actually assess — its boundaries, its value, its history and what may be built on it, in one place.
Cadastral boundaries, municipal valuation rolls, deeds transactions, zoning records and building footprints, ingested continuously.
Sources disagree. We match them property by property, keep the discrepancies visible rather than averaging them away, and record what each source said.
An estimate with a range, set alongside the municipal figure and the last recorded transfer so you can see where they differ.
On the map, in a report, or through the API — the same reconciled record, whichever way you reach it.
Estate agents
Value a property, pull its history and generate a client-ready report without paying per lookup.
Sellers
The municipal value, what the neighbours sold for and the figures behind both — so you can weigh any price you are quoted against the record.
Buyers
Zoning, erf boundaries, building footprint and title history — the checks that usually happen too late.
Investors & developers
Value density, transaction velocity and yield across whole suburbs, including stock that never reaches a portal.
Search any property in our coverage area and see the full record. No account, no per-lookup fee.
 FoundRE