Open the map and every property in the coverage area is already there — valued, zoned, measured and traced back through its transfers. No listing required, because nothing here depends on one.
Most property maps show you what is for sale. This one shows you everything — every erf in the municipality, each carrying its municipal value, its zoning, its size and its history. Filter it down and the result is a list of properties nobody has advertised.
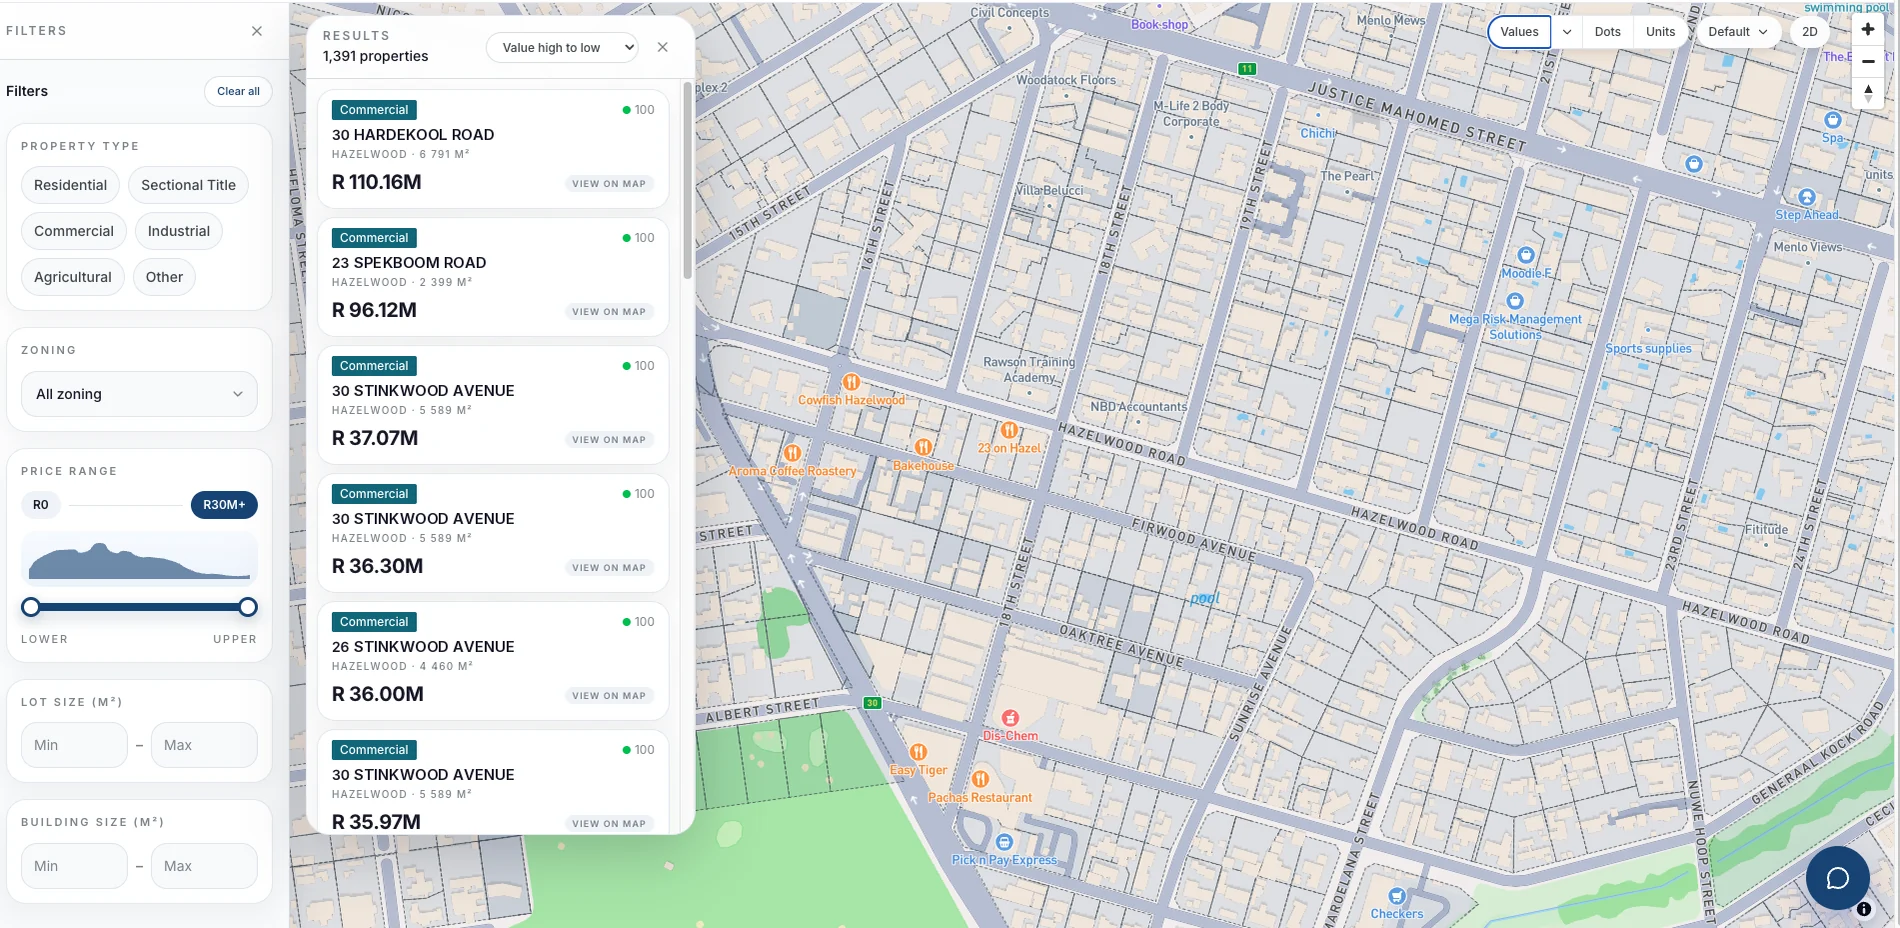
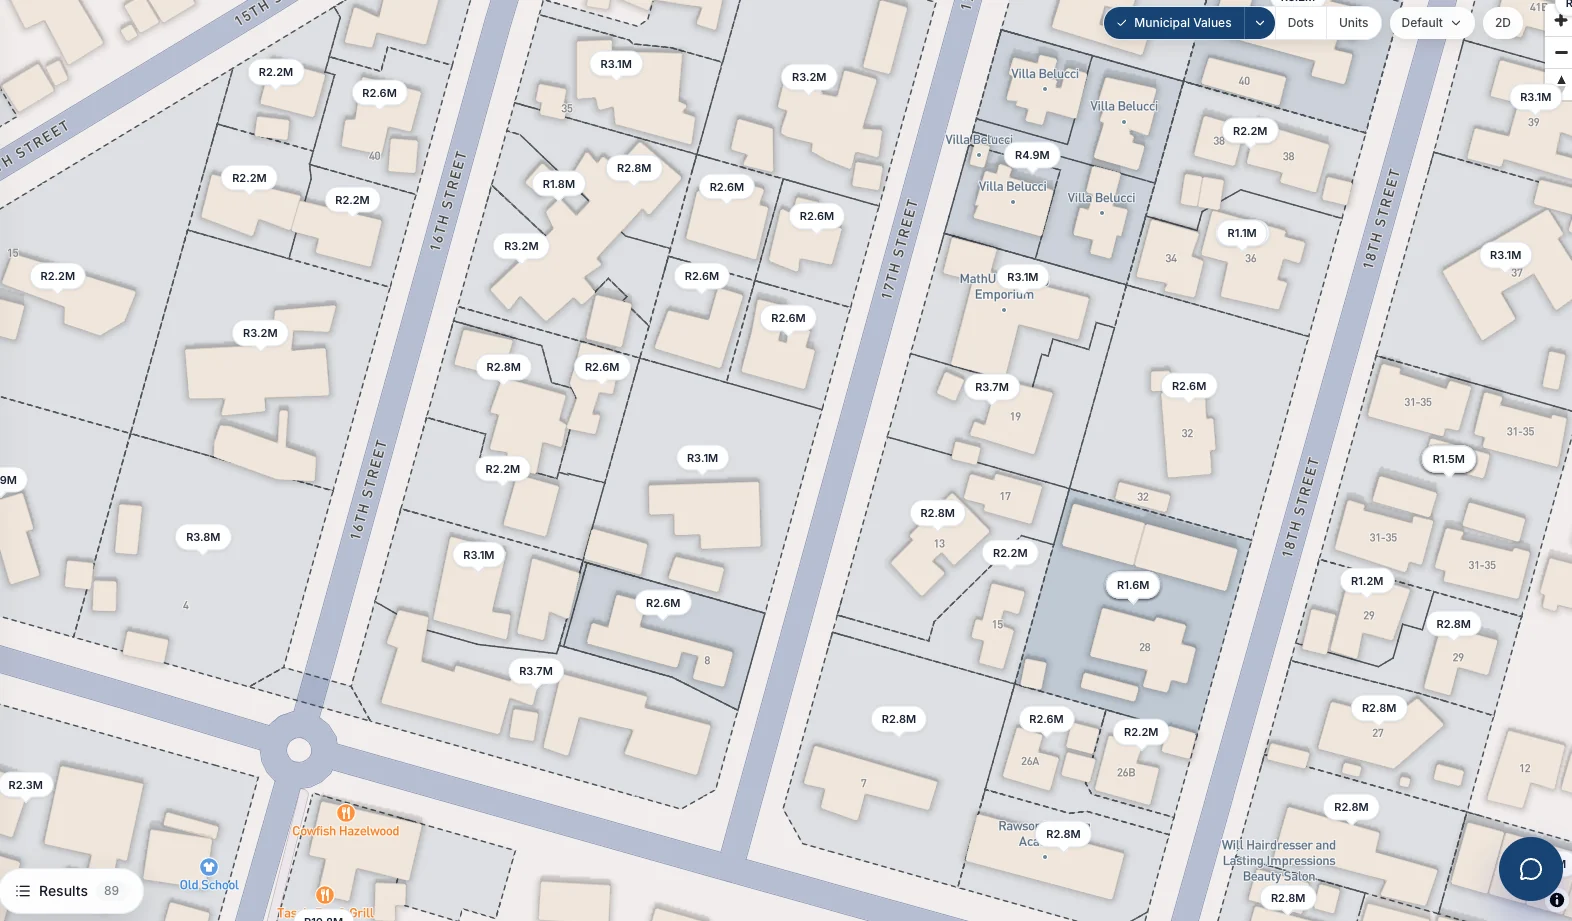
Zoom in and the value sits on the property itself, alongside the cadastral boundary and the building footprint. No hovering, no clicking through — the whole street reads at once.
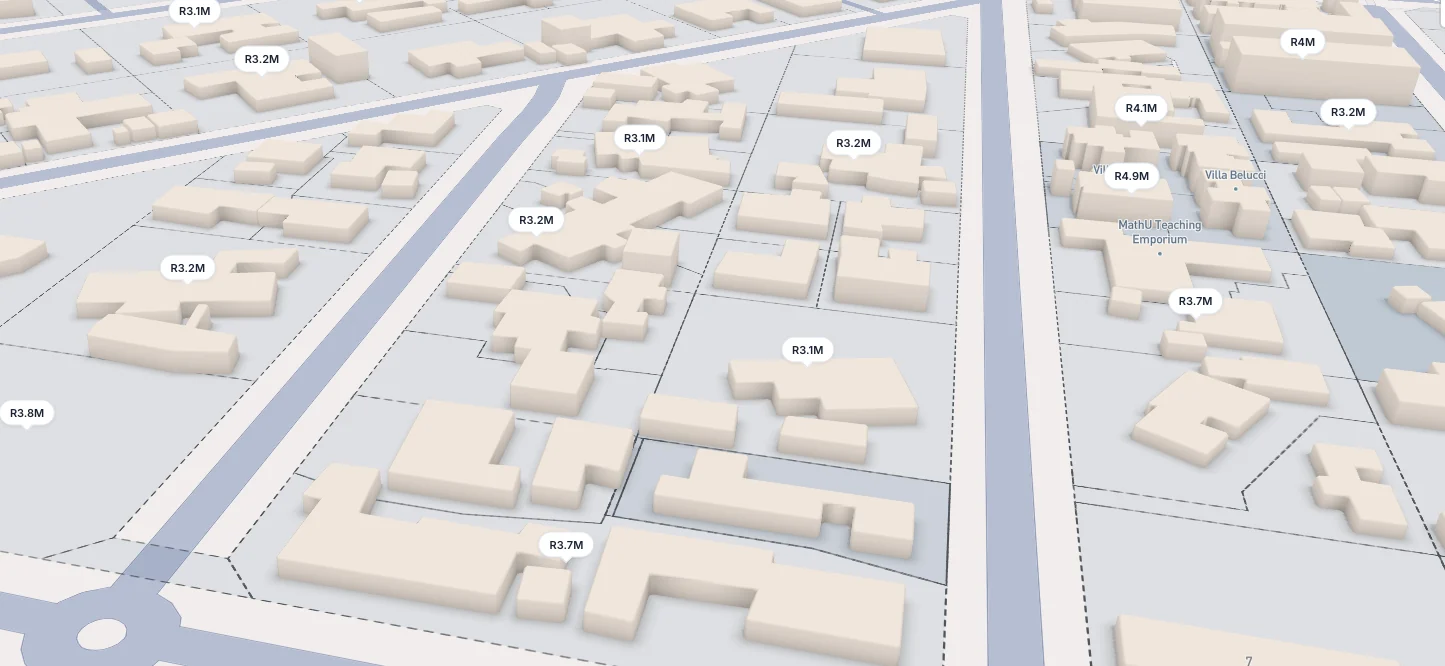
Switch to 3D and the building masses come up out of the ground. Useful when coverage, bulk and the difference between a single storey and a walk-up are what you are actually assessing.
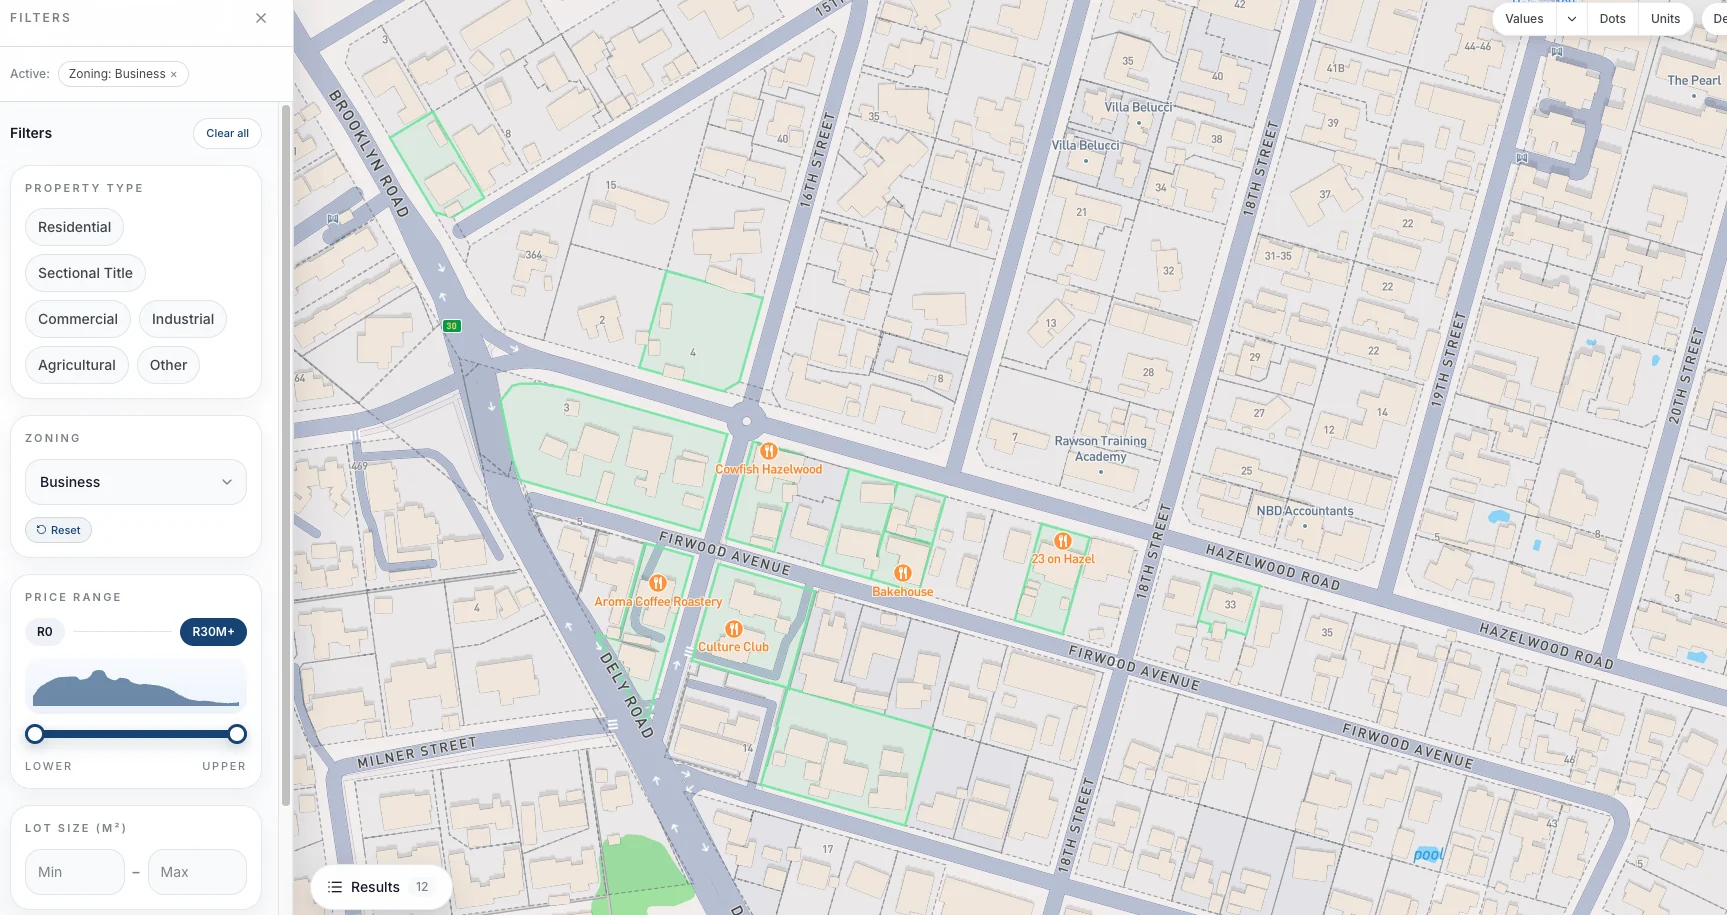
Apply a zoning filter and only the matching erven stay lit. Twelve business-zoned properties on this screen, picked out of several hundred — the kind of question that otherwise takes a town-planning enquiry.
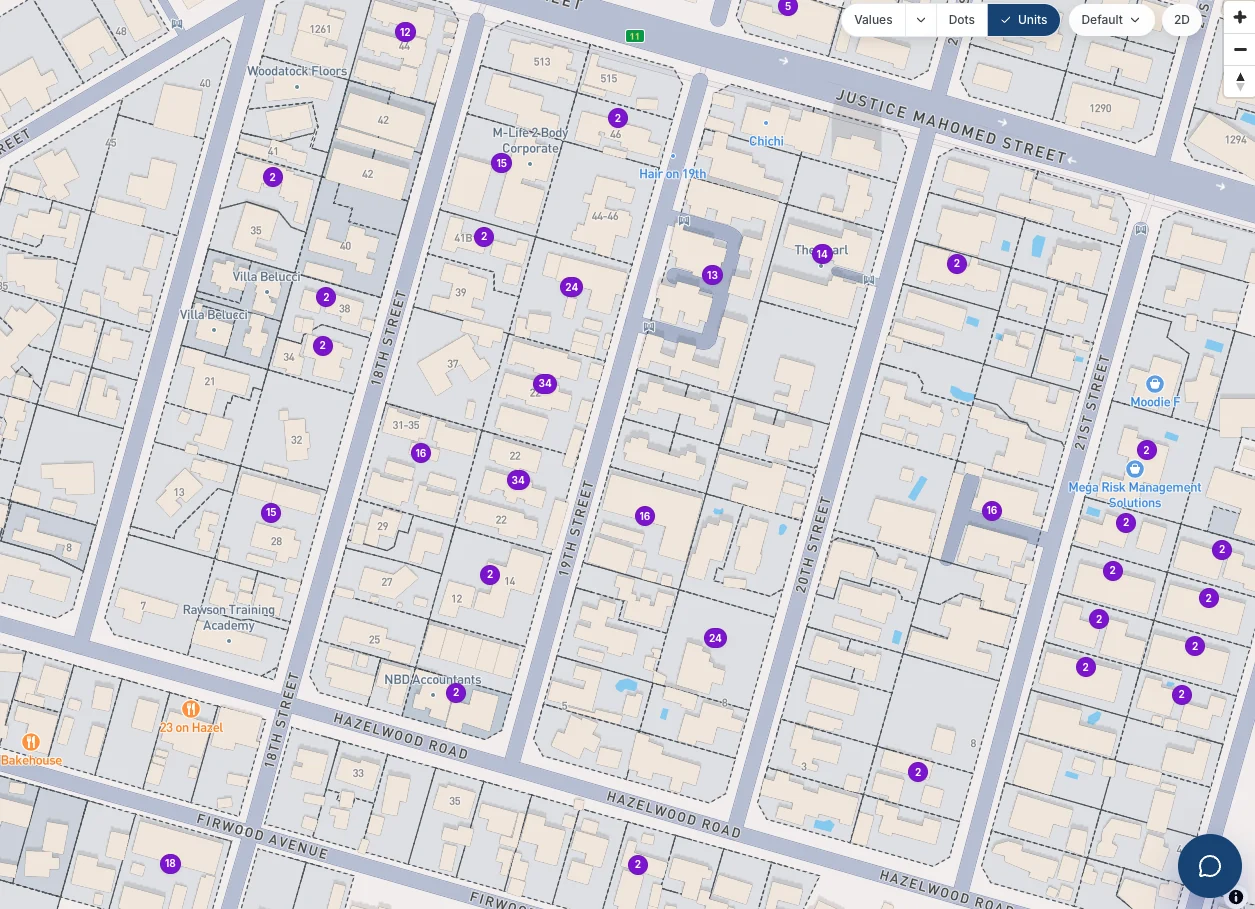
Units mode replaces the value with the number of units in each sectional title scheme, so a block of flats reads as thirty-four doors rather than one address.
Screens captured from the platform · Property identifiers replaced with an invented record
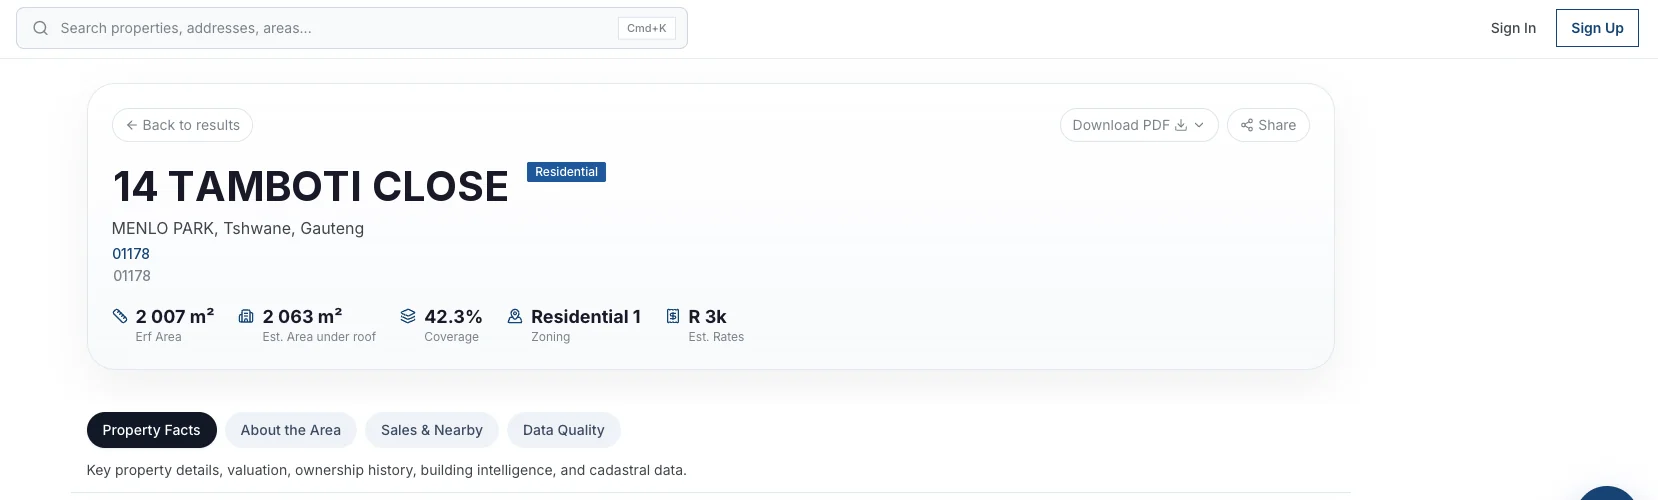
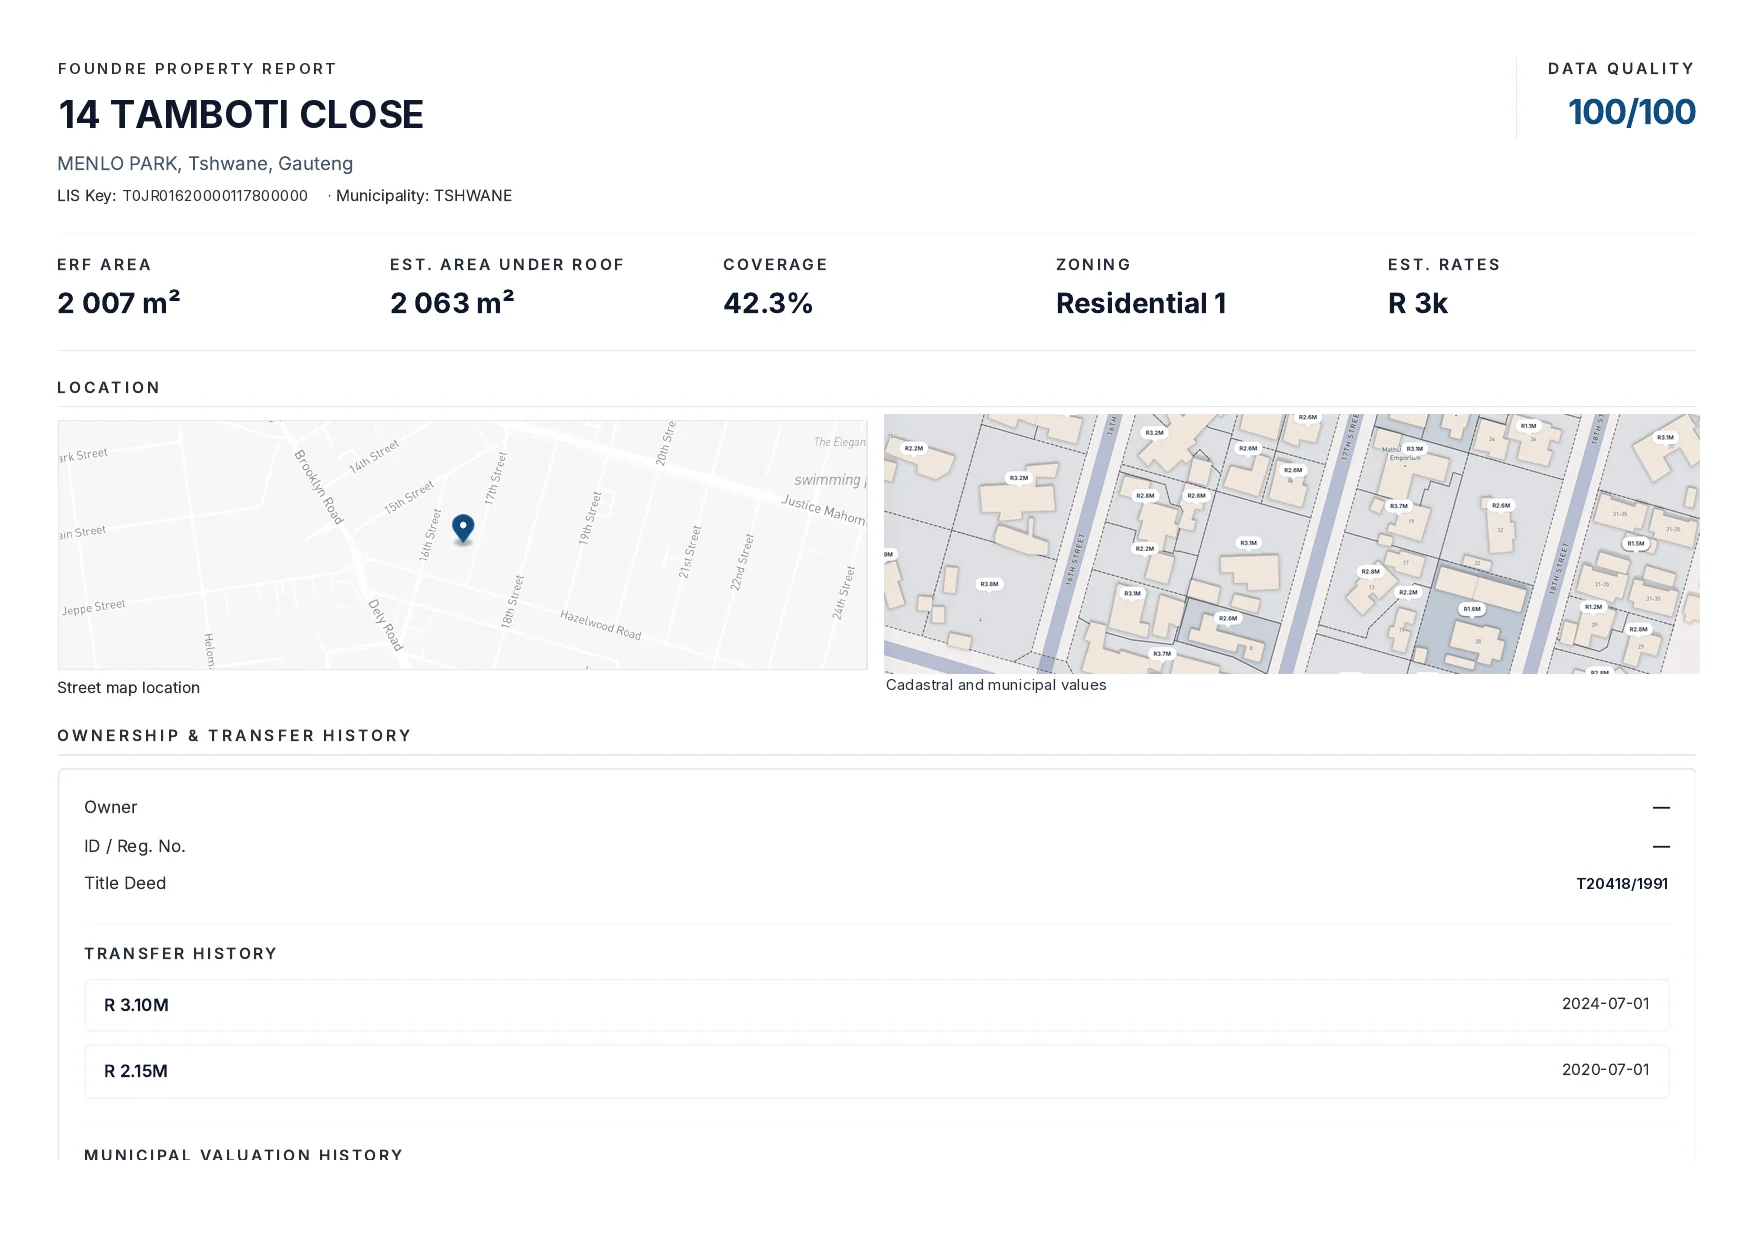
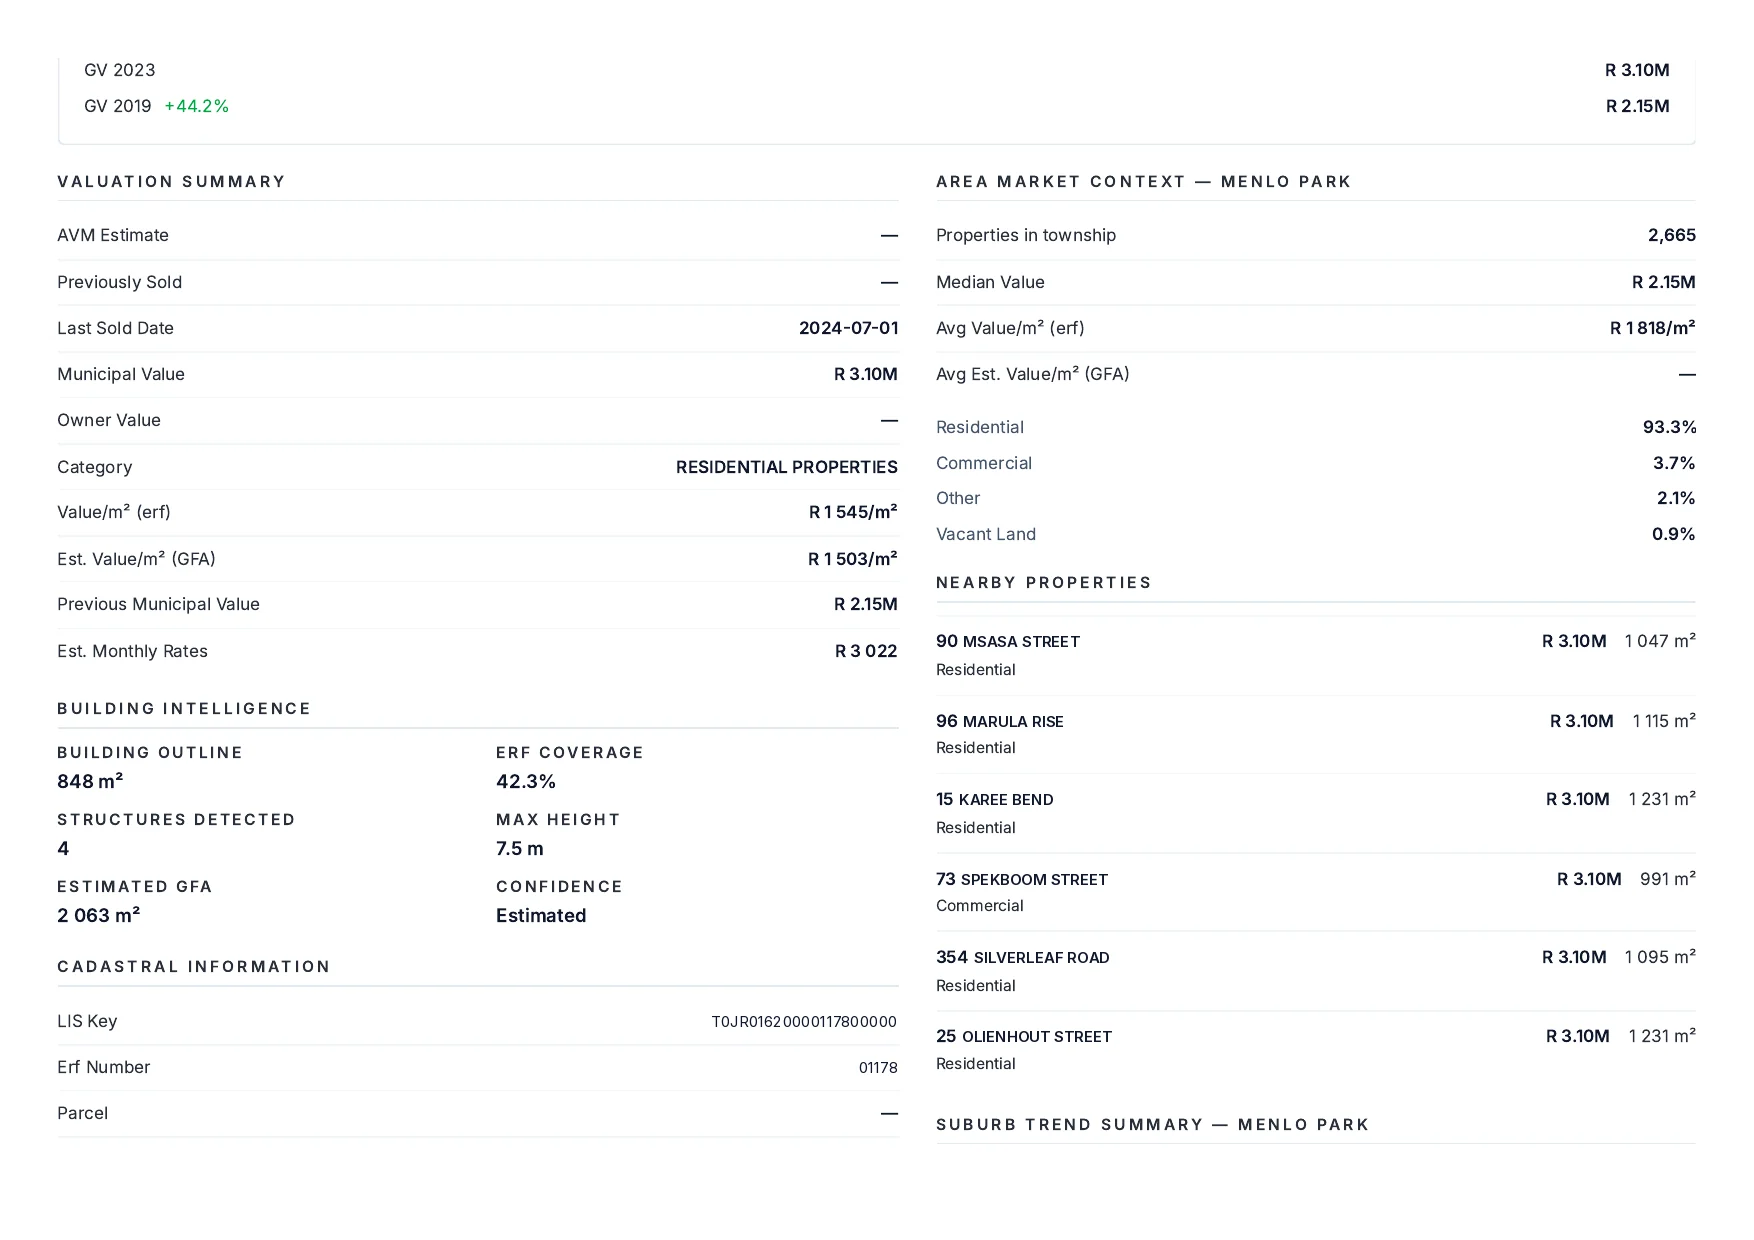
Zoning, erf size, area under roof, coverage, rates, municipal value and how that value moved between valuation rolls — assembled from the deeds registry, the municipal valuation roll, the town planning scheme and building outlines detected from imagery.
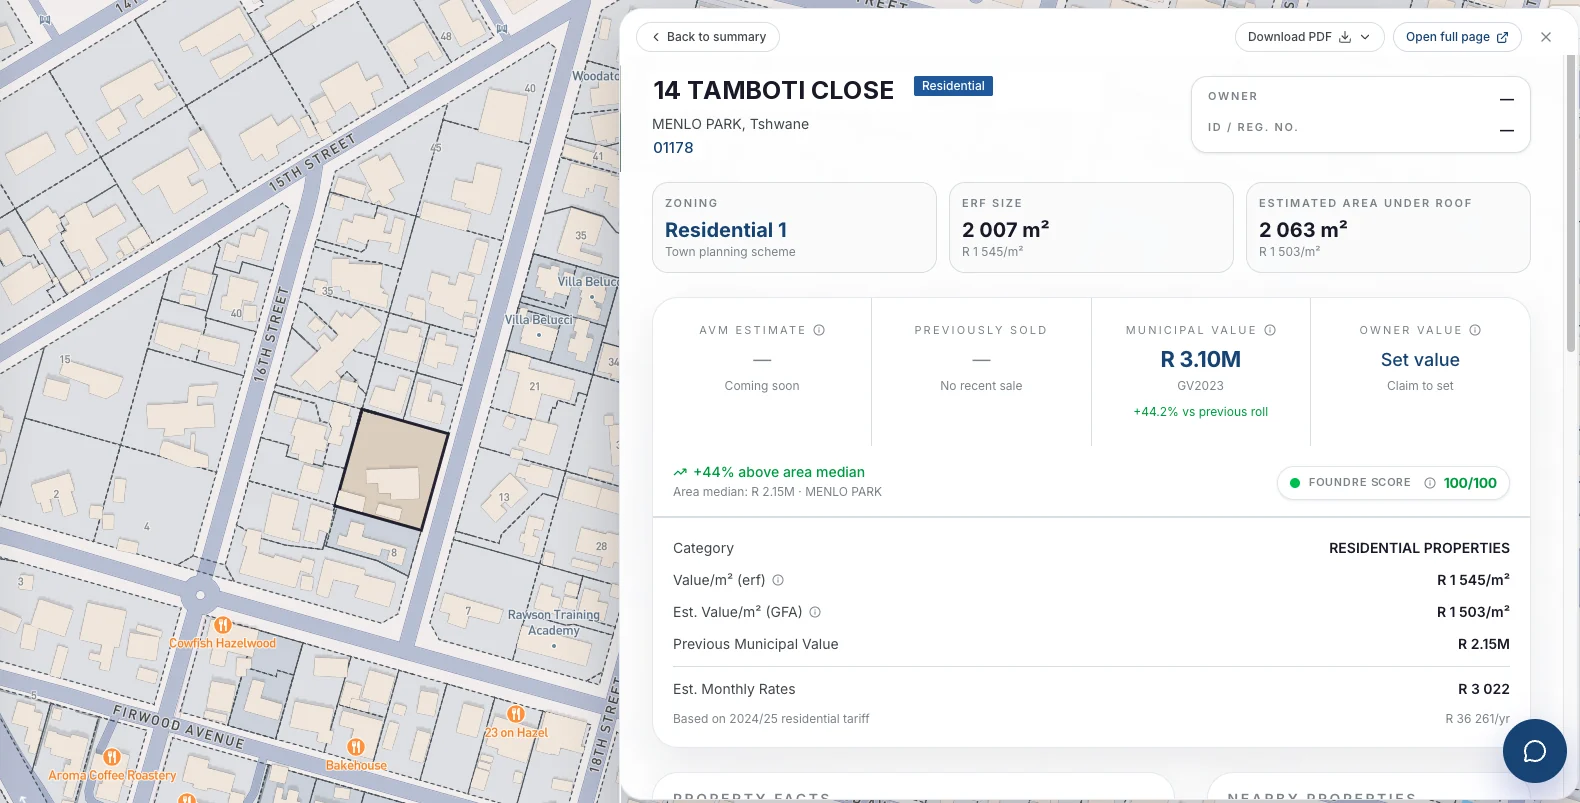
The same record opens as a panel over the map, so you can work a street without losing your place. Municipal value is shown next to the previous roll and the area median, and the owner fields stay blank unless you have the standing to see them.
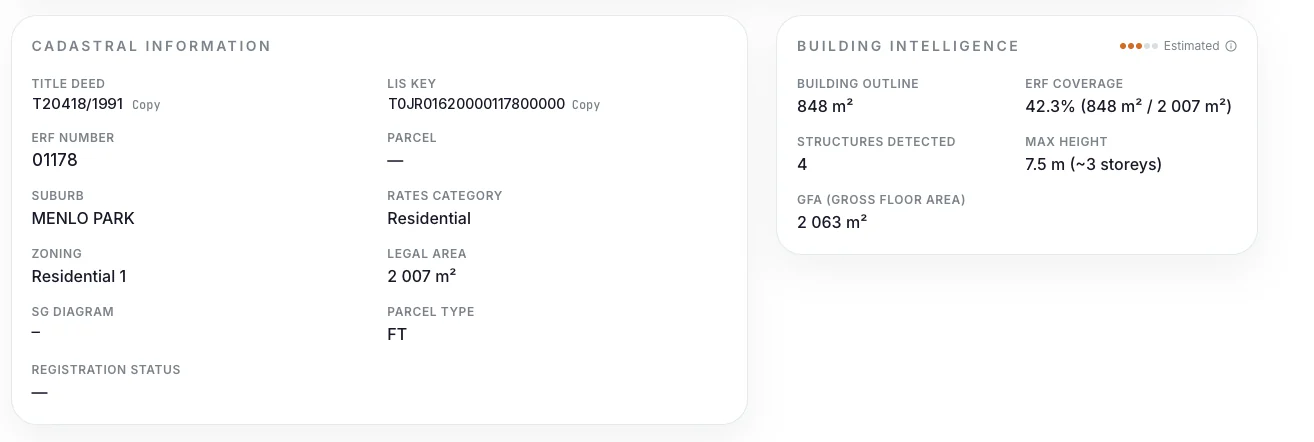
The left half is what the registry holds — title deed, LIS key, erf number, legal area, rates category. The right half is measured: the building outline, how much of the erf it covers, how many structures stand on it and how tall they are. The confidence of the estimate is stated rather than implied.
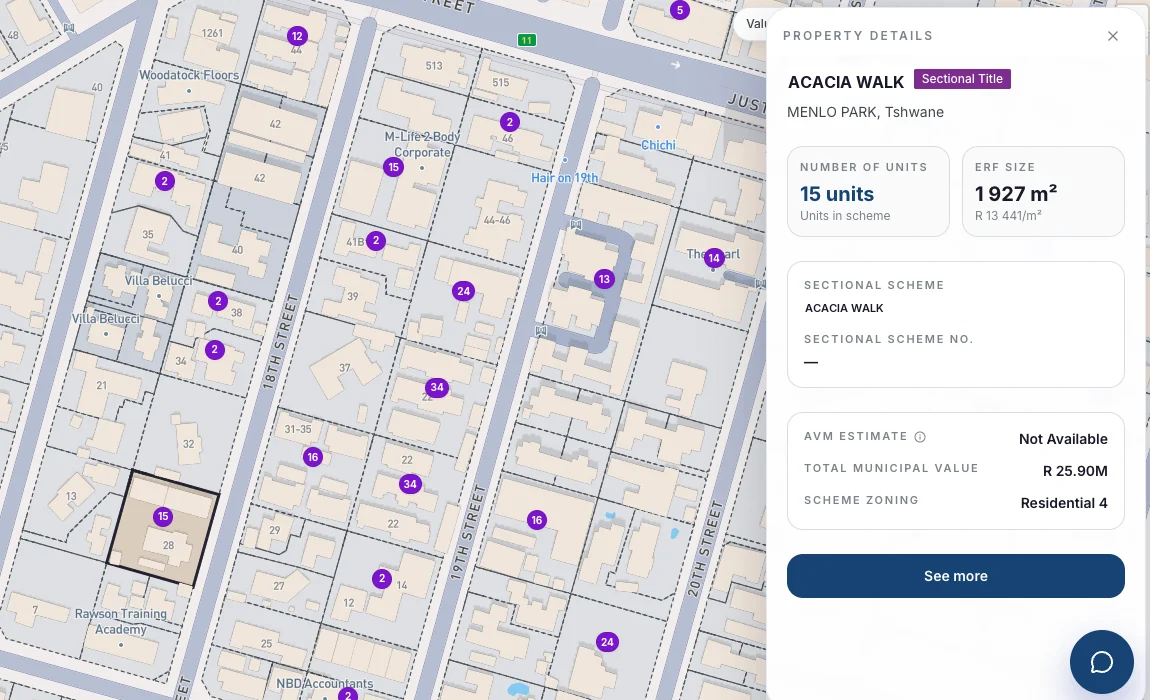
A sectional scheme is not one property and the record does not pretend otherwise. The scheme opens with its unit count, its total municipal value across all units, its erf size and its scheme zoning — then you can go into the individual units.
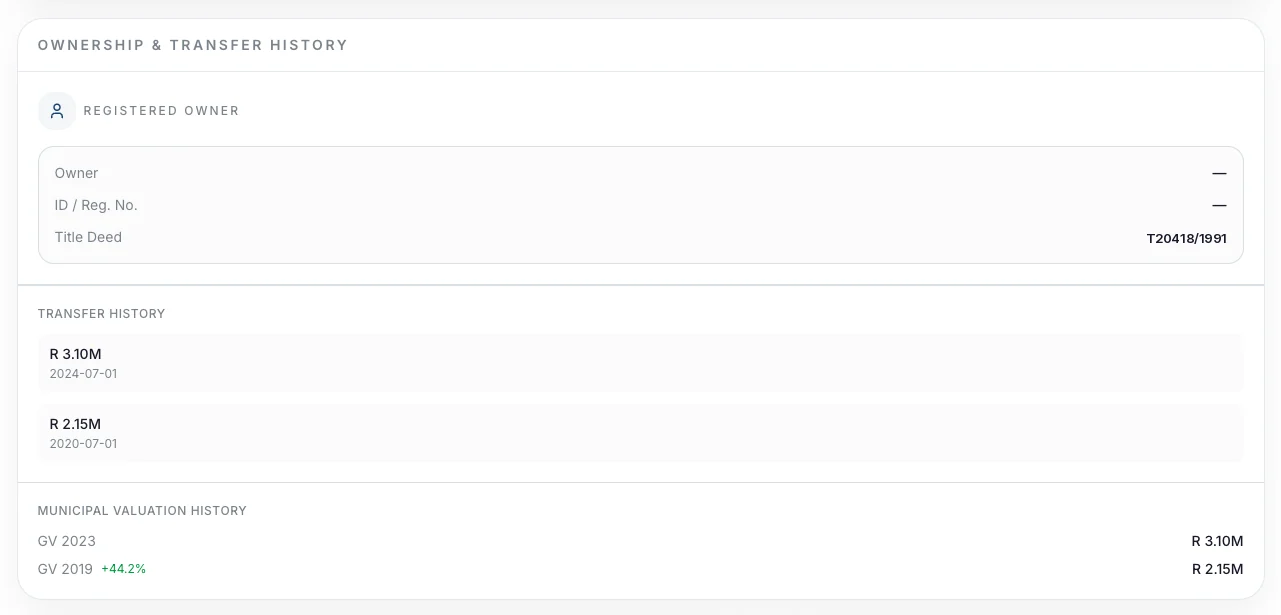
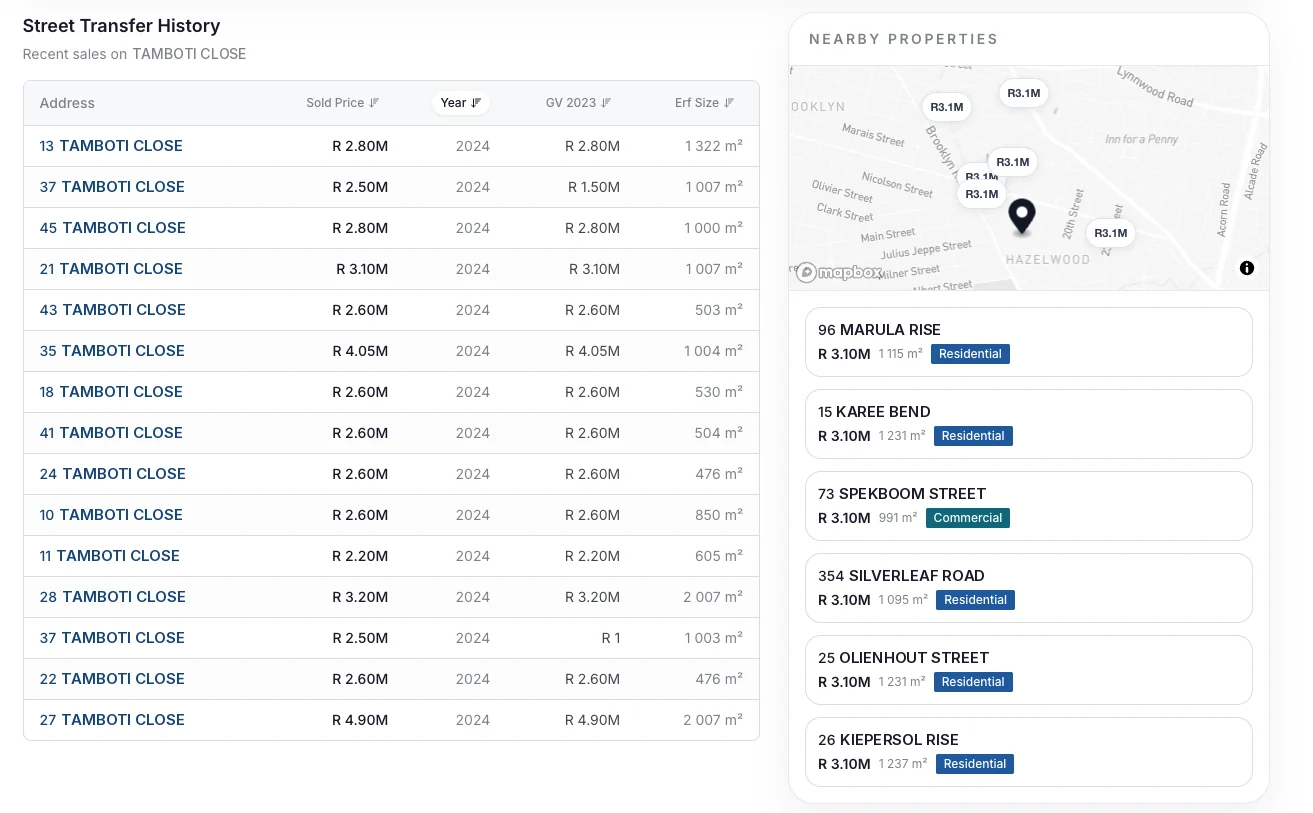
A price only means something next to other prices. Every record carries its own transfer history and its municipal valuation history, and then widens out to every recent sale on the same street.
The title deed and each recorded transfer, then the general valuation history underneath it. Reading the two together is how you tell a real movement in value from a revaluation — here a transfer at R 3.10M against a roll that moved 44.2% between GV2019 and GV2023.
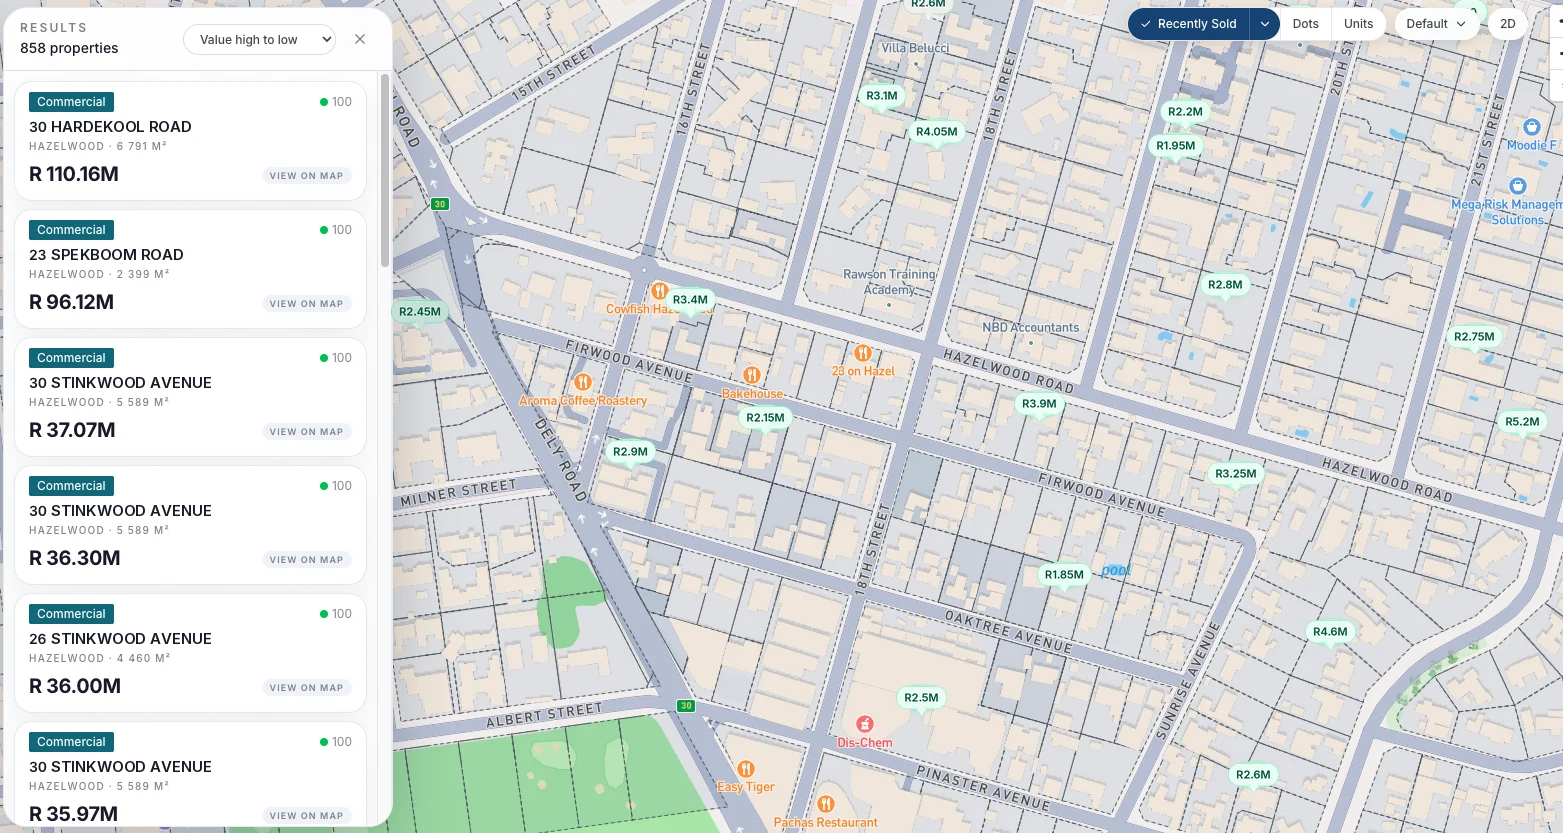
Switch the map to Recently Sold and every erf with a recorded transfer carries what it went for. The area stops being a set of council valuations and becomes a record of what people actually paid — which is the number that settles most pricing arguments.
A property is worth what its area supports. Each record carries an area profile and a market trend built from recorded transfers — not from asking prices.
What kind of place this is: the character of the housing stock, the schools in the suburb, the amenities within reach, and a read on safety and walkability.
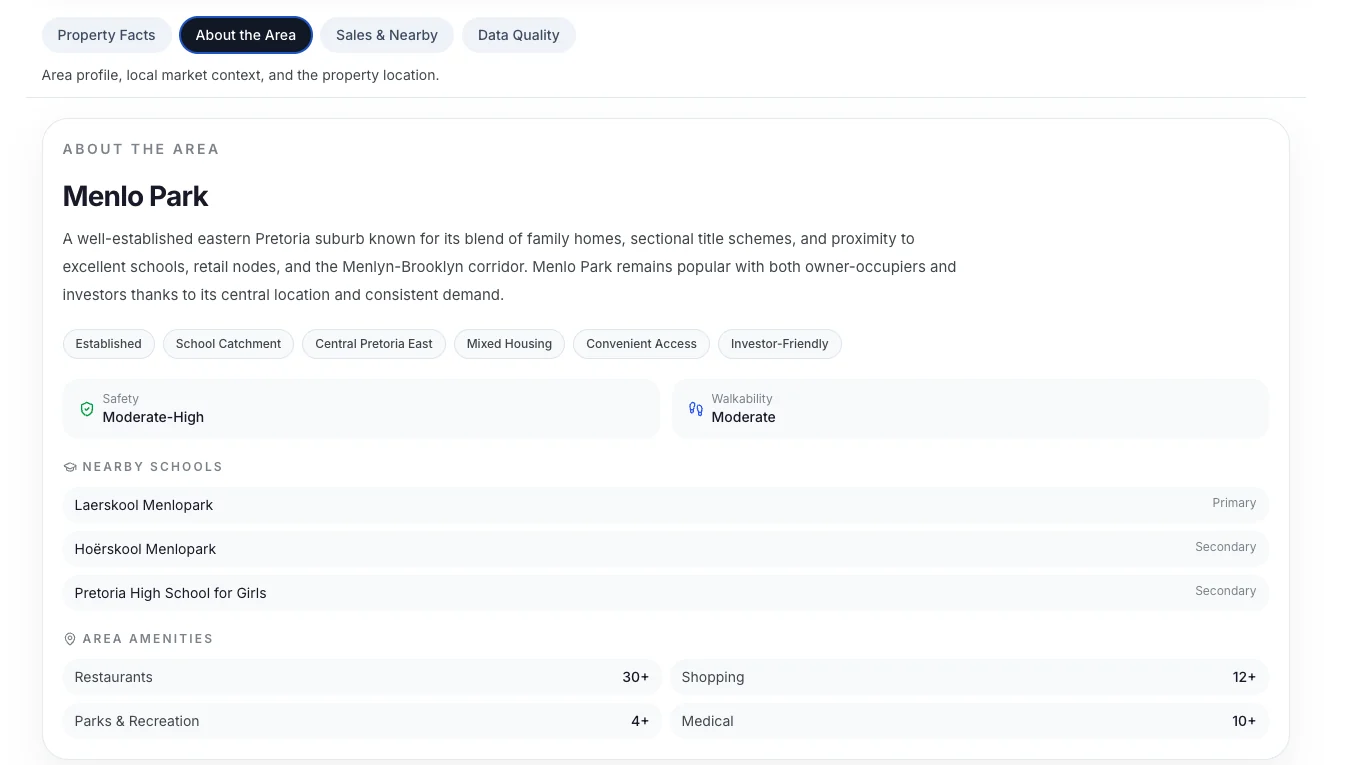
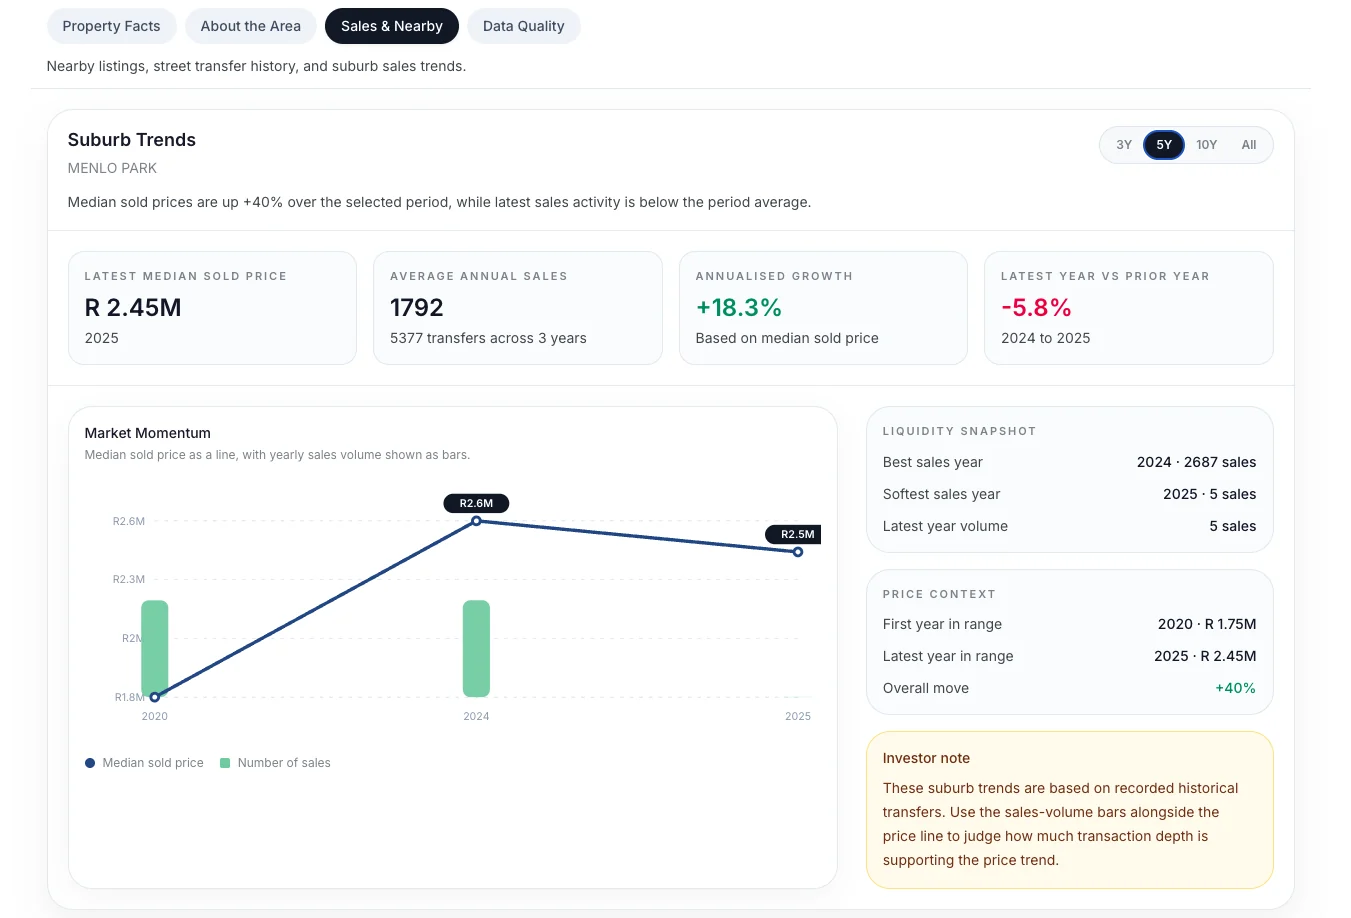
Suburb trends are built from recorded historical transfers, not from listing prices
Four reports, each pitched at a different scale — one property, one suburb, a whole town, or a valuation on its own. Generated on demand, dated, and carrying a data quality score so the reader knows how complete the record behind it is.
Available now
Everything held on a single property — headline figures, location, ownership and transfer history, valuation summary, building intelligence and area context.
On the roadmap
The same analysis at suburb level — median sold price, growth over the period, transaction volume and how liquid the market has been.
On the roadmap
Suburb analysis widened to a whole town or municipality, so a market can be judged as a market rather than street by street.
In build
The automated valuation for a property on its own — the estimate, its range, and the figures it was reconciled against.
Export a filtered set to CSV and take it into your own model.
The same property intelligence delivered into your systems, for lenders, developers and platforms.
In build
An automated estimate with its range, shown next to the municipal figure. The map switcher is already there; the model is not yet populated.
On the roadmap
Zoning as a map layer in its own right, not only as a filter and a field on the record.
On the roadmap
Track a set of properties together, with value movement across the group.
On the roadmap
A pre-purchase compliance summary covering zoning, plans and title.
Anything marked "in build" or "on the roadmap" is not available yet. Everything shown in the screens above is in the platform today.
Search is free and needs no account. Start with an address you already know.
 FoundRE